Collaborative
workspaces
Objective
Revolutionize how research and resources are managed within the IonQ Quantum Cloud Console, particularly for larger customers in government, research, and enterprise sectors.
Problem Statement
Scalability Issues: Existing tools couldn’t handle the growing complexity of managing quantum research projects.
User Challenges: Users struggled with resource management, job tracking, and budget visibility.
Seamless Transition: Ensuring a smooth migration to a new cloud architecture without disrupting existing operations.
Key Goals
Streamline project and resource management
Enhance user engagement and retention by creating a more collaborative and user-friendly experience
Simplify the transition to a new cloud information architecture
Business Opportunities
Attract new customers
Support ongoing sales efforts
Decrease the reliance on our engineering team by empowering users to be more self-sufficient
Impact
The features that I designed are a direct answer to the resource management needs of large enterprise, government, and research lab customers. By showcasing them either fully built or prototyped features, they gained confidence that we can reciprocate with their needs and built something that resonates with them. Budget management features turned out to be the most useful for the particular state of the art in the industry. Got plenty of positive feedback and 40% of projects currently have budgets configured.
Solution
In order to address this problem, I designed "Projects" - a secure and collaborative workspaces that lets users submit their work to a shared space.
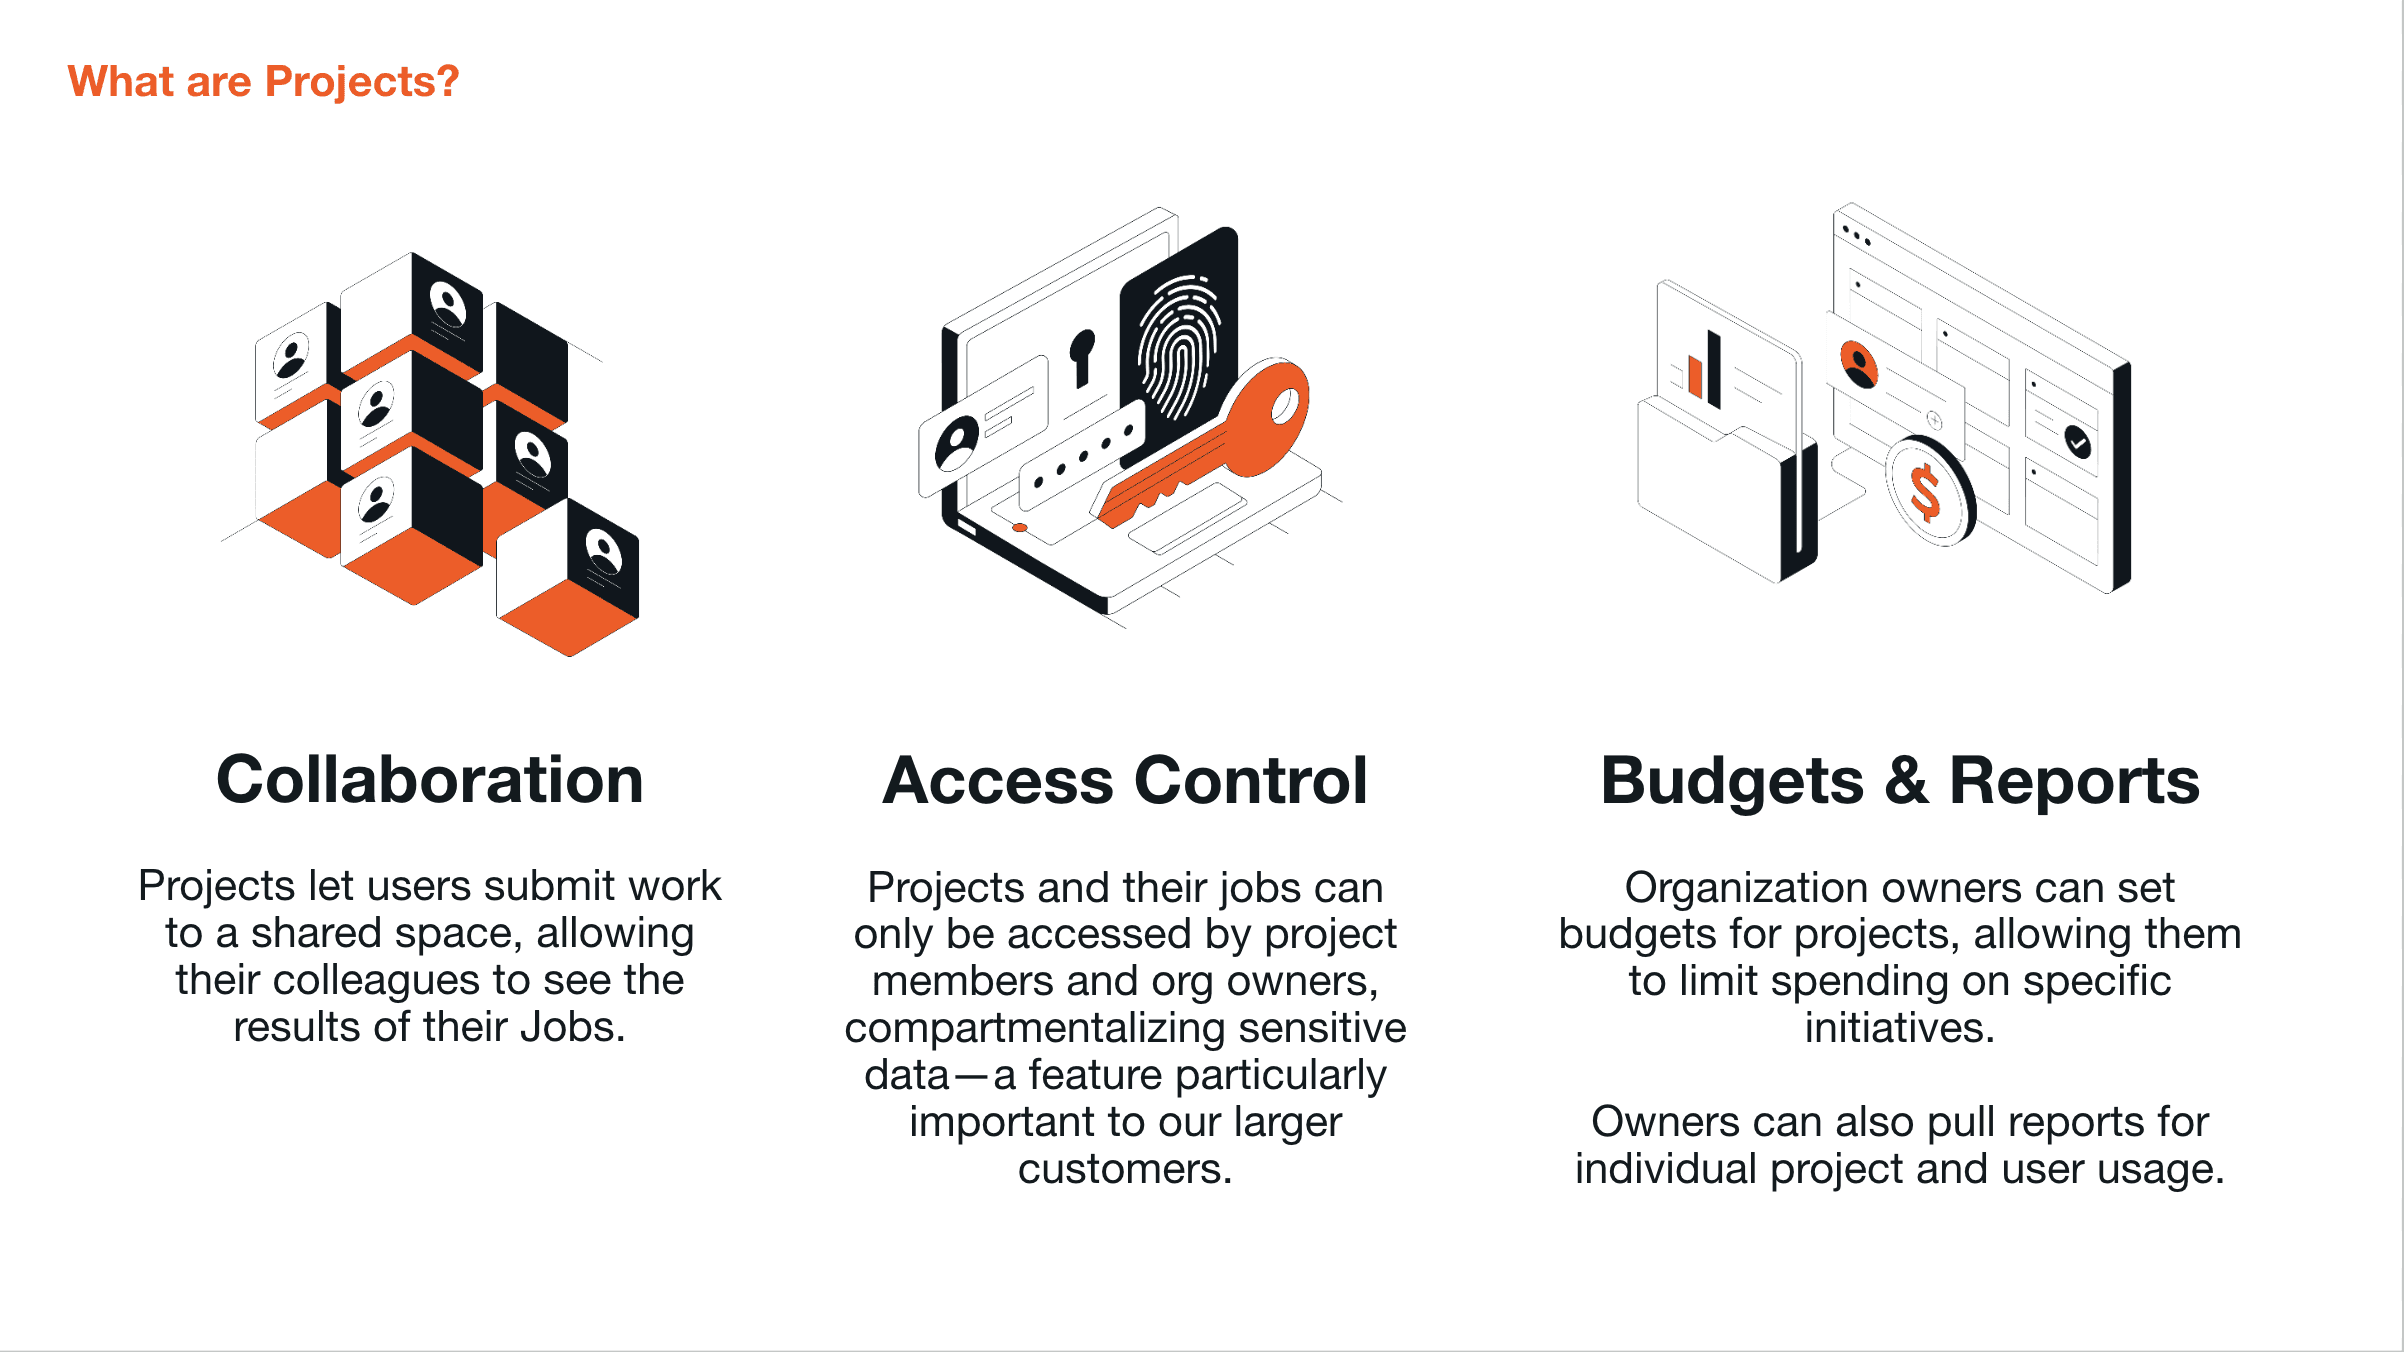
Slide we used to introduce the new features to the internal teams
Key features
Create new project
Every organization member can now create projects in their organizations Projects can have assigned budget or not. When a project budget is hit, no additional jobs can be submitted to it. Project members after being invited to the project can submit jobs to it.
Create new project
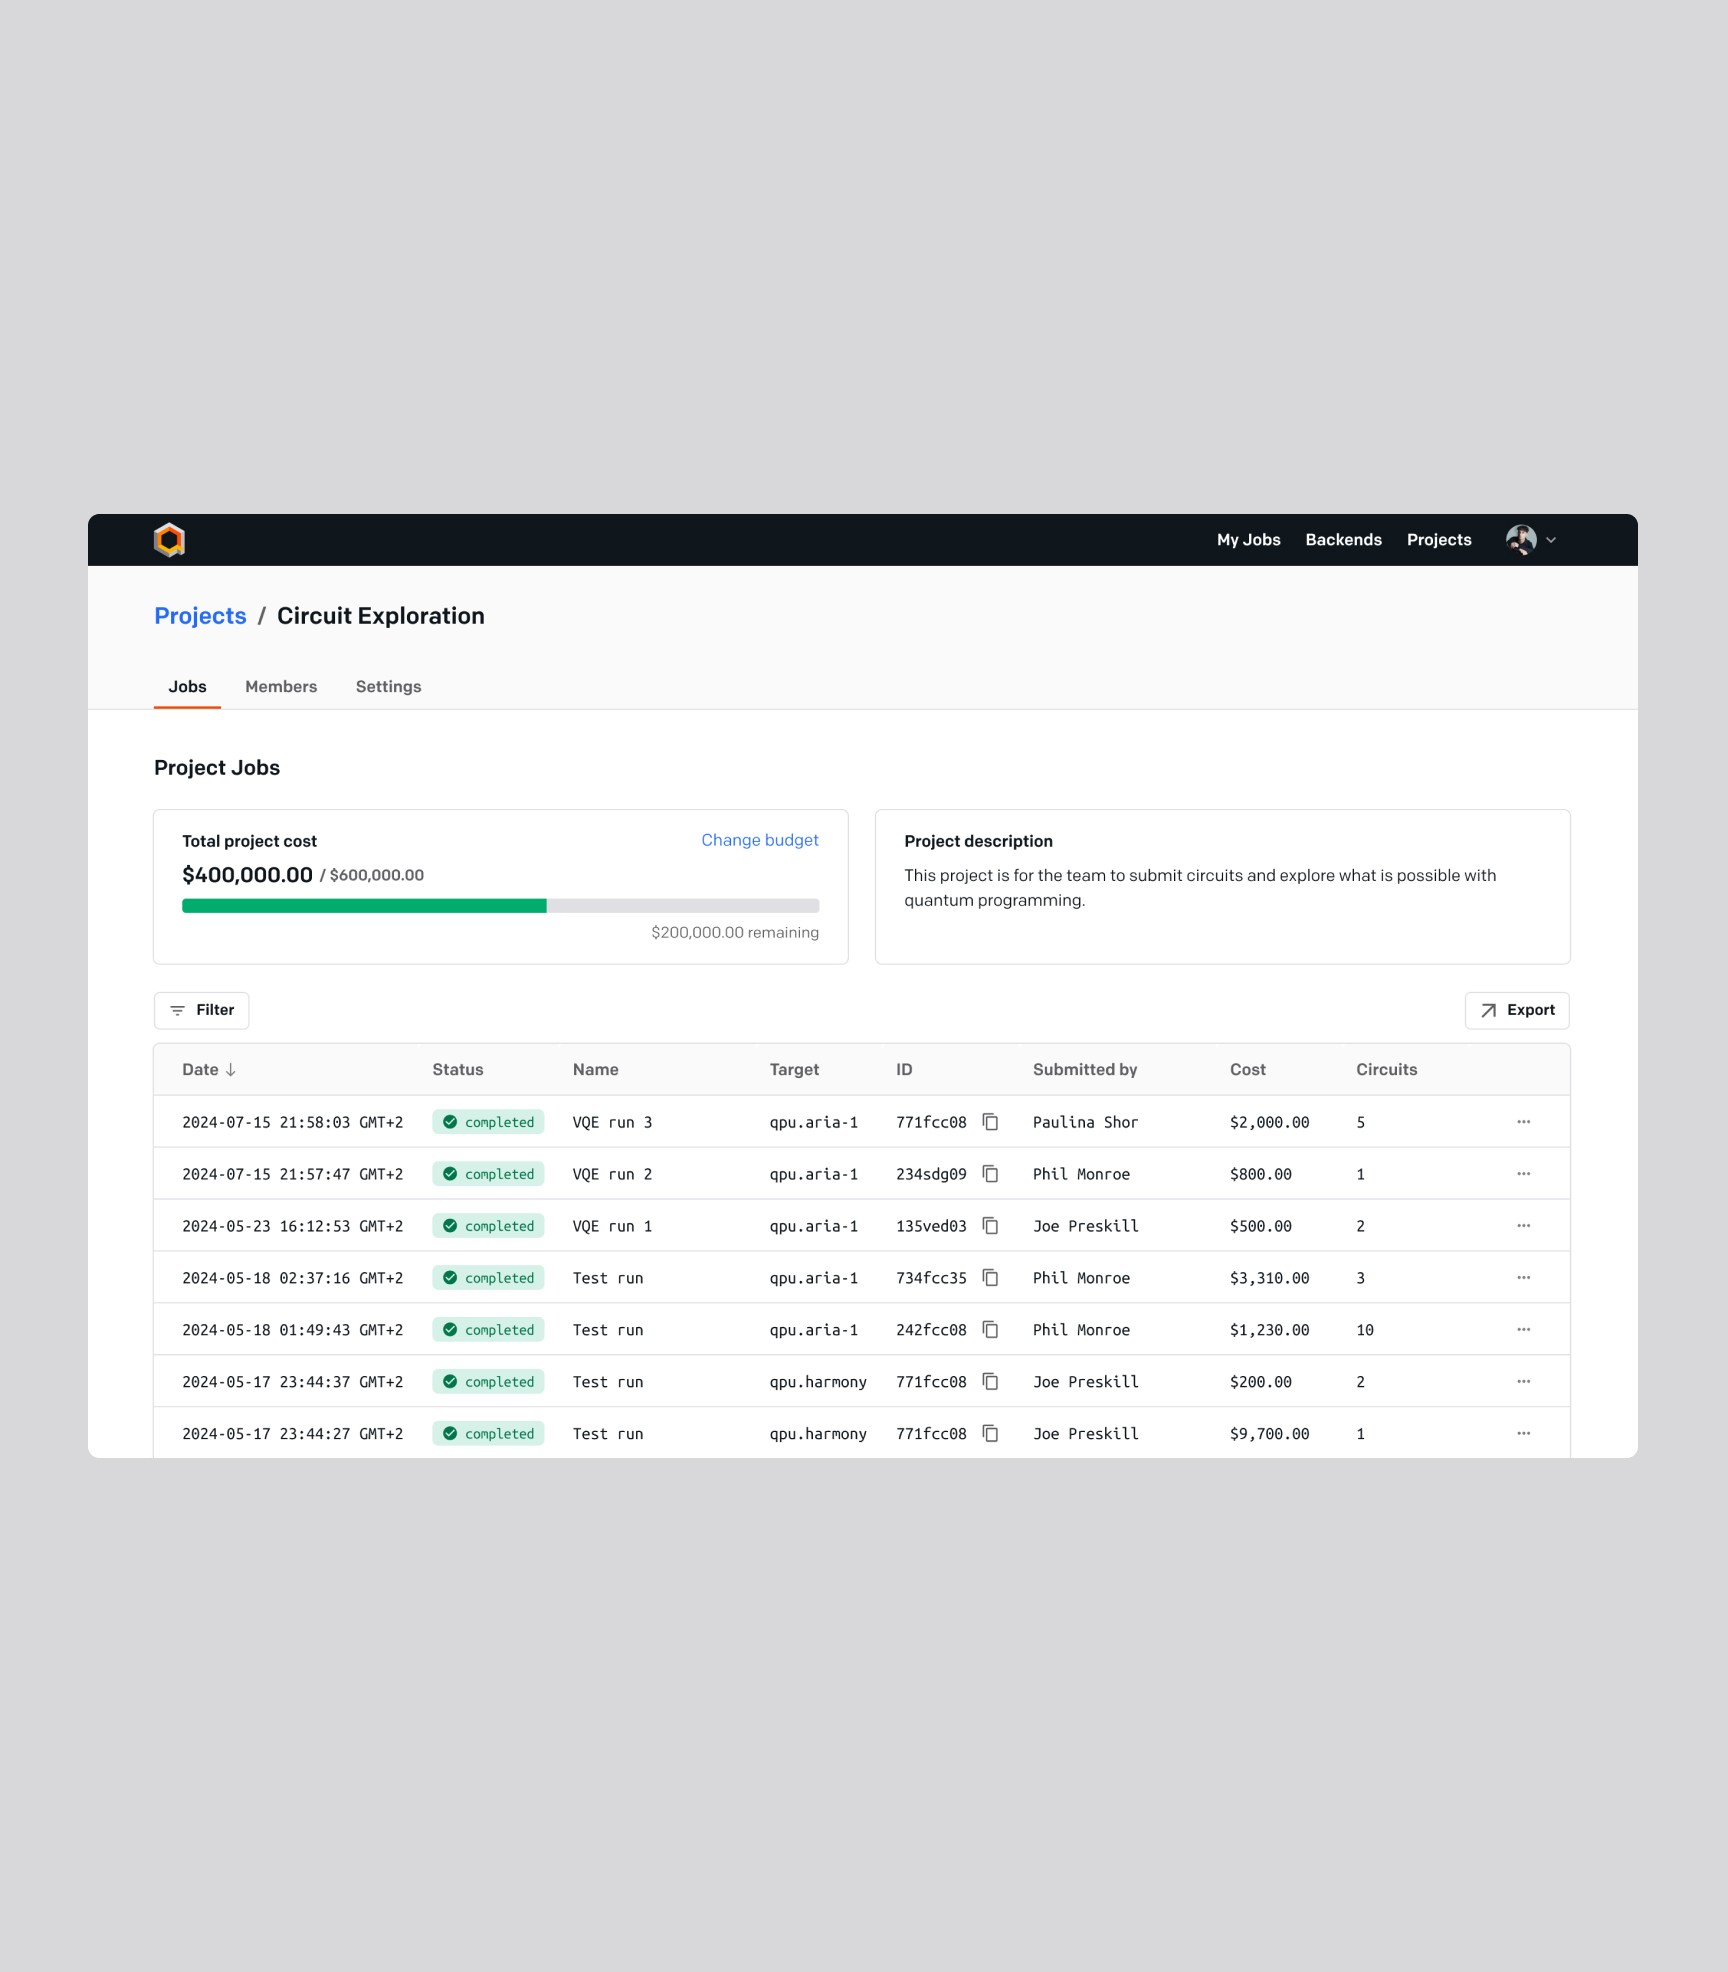
Manage workspace
Projects provide the first shared space in the product-you can organize users into groups, submit jobs to one place and share the results of their work together, share a budget to work within, and keep track of how much they're spending collectively.
Change project budget
Change project budget
Every project's budget can be changed at any time. All you need to do is head to the project space and click "change budget" in the project cost tracker. It will allow you to assign a new value to the budget or mark it "unlimited".
Change project budget
Add organization members
In order to invite members to the project, they need to be invited to the organization first. They will be assigned a role. Once they accept the invite they can be added to the project to start submitting jobs to it. Or they can do it to their personal project created once they join our platform.
Add organization members
Add members to a project
Adding members to the project is very easy! All you need to is type their email address or first and last name and they should pop in the dropdown list. Once they are selected you need to confirm your choice and add them to the project. They should receive an email from us saying they are part of the project.
Add members to a project
Generate API key
Project members in order to submit jobs to the project they need to generate API keys first. They can do it on the API keys page. They will need to choose a project to which API keys will be assigned to. After that the API key is generated and they can copy it.
Generate API Key
User Research
There were some old notes created by my managers talking to customers about their needs around the features we were building. I became familiar with them and helped to understand directly from customers what they needed.
Given that it was challenging to find time to speak directly with our customers, I primarily relied on the PRD provided by the product managers to inform my understanding of the required features. Since the product managers had engaged extensively with customers to gather their needs, the PRD served as a reflection of those insights.
Like any feature on our roadmap, this set of features needed to be mapped out by the PMs. The detailed PRD provided valuable guidance on our long-term vision, which I used to clarify my understanding of the business objectives, the scope of the support needed, and the broader context behind the desired platform direction.

Mapping session with PM

Roles mapping exercise
Competitive Analysis
I looked up products that served as tools for developers and had project management features in there such as github, gitlab, mongodb, mode and sigma computing. I was interested in investigating the end to end experience.

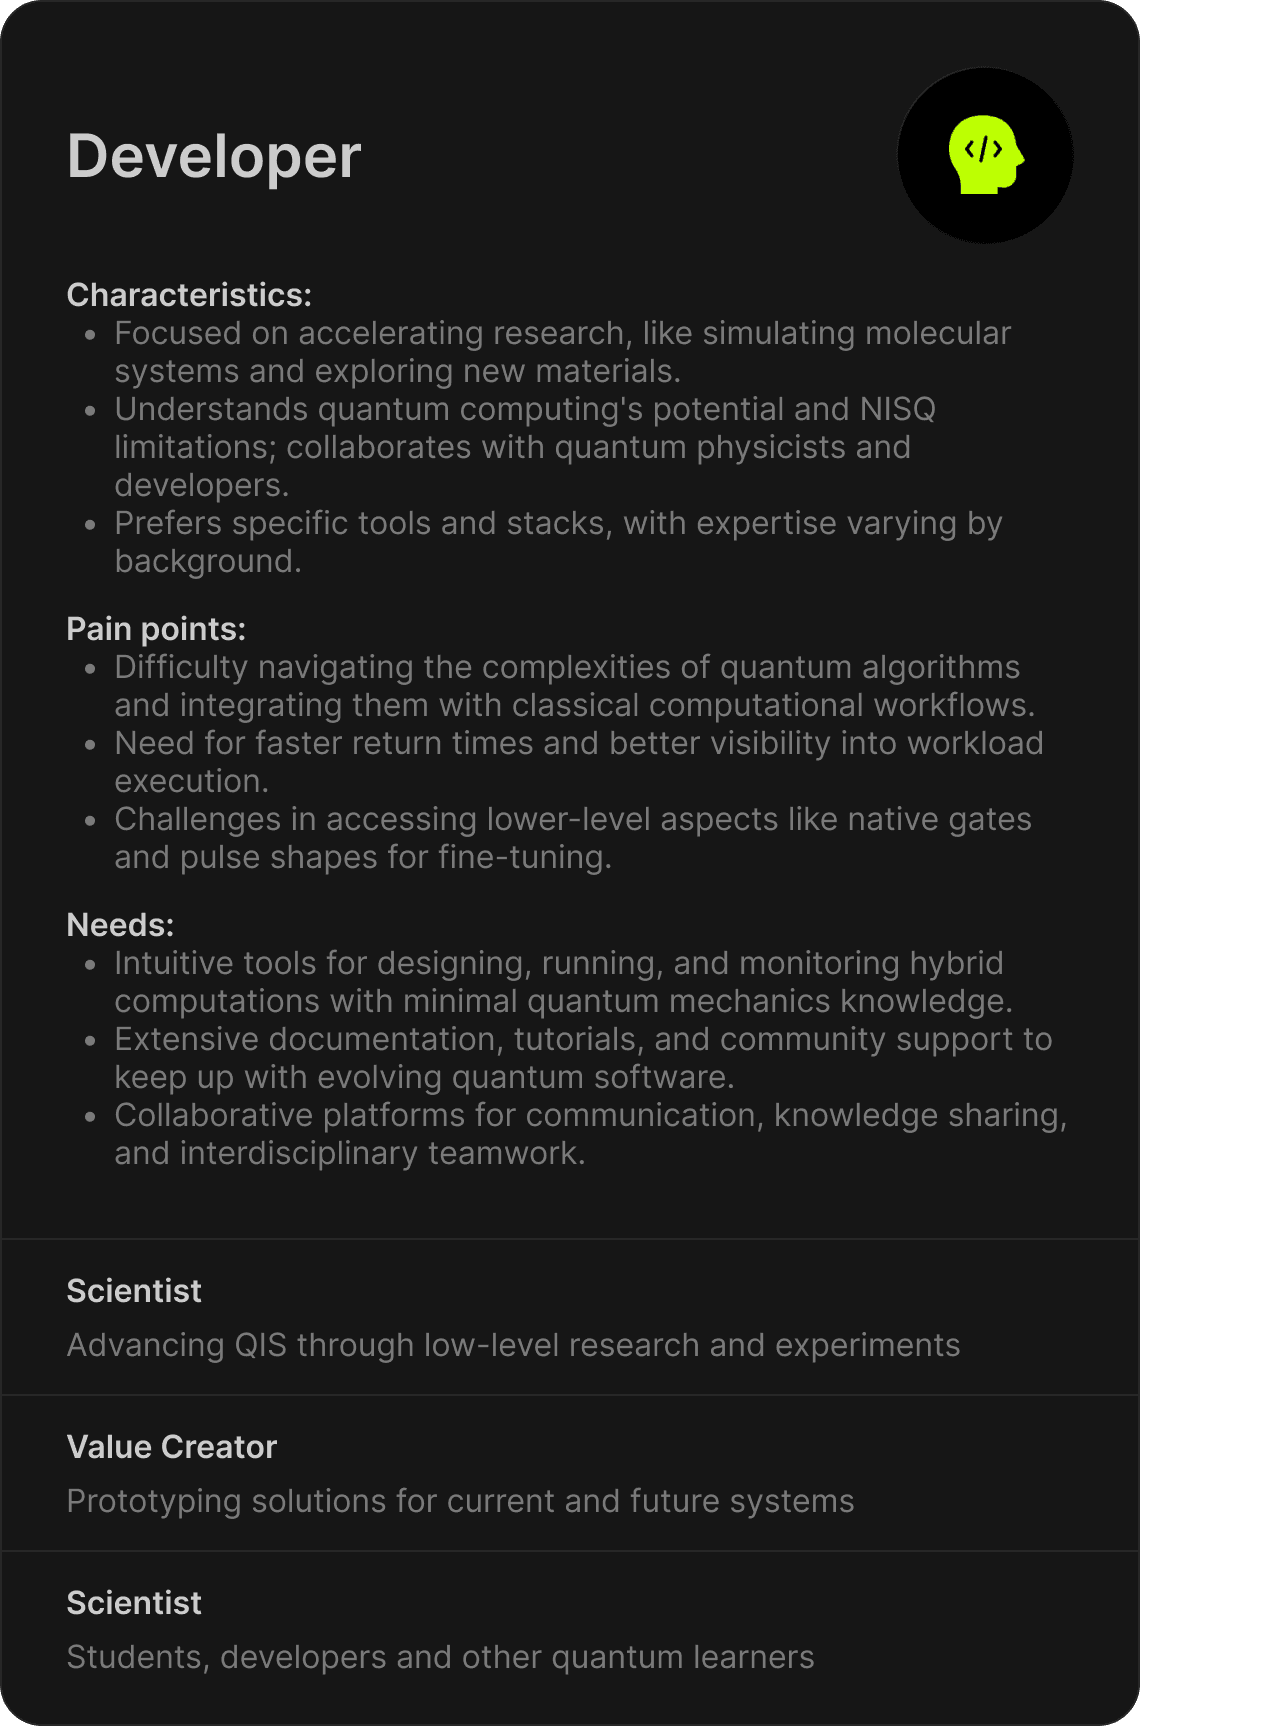
Personas and User Journeys
Budget Holders: Individuals responsible for managing project budgets and ensuring resources are allocated effectively.
Project Managers: Key users who monitor resource usage within their teams and address any access issues.
Quantum Developers: Users who actively run quantum jobs, develop algorithms, and play a crucial role in advancing research on the platform.

Information Architecture
Before introducing a new concept to our cloud console architecture, I had to think about where and how it would fit in in relation to the rest of the system. Similarly, engineering had to start thinking about how our quantum platform should evolve based on the addition of the layer of organization - collaborative workspaces.
Organizational principles
Workspace: an individual user instance, housing their content
Budgets: organisation has a quota as well as the users
Organisation members: Individuals that get invited to the organization. They must have a role
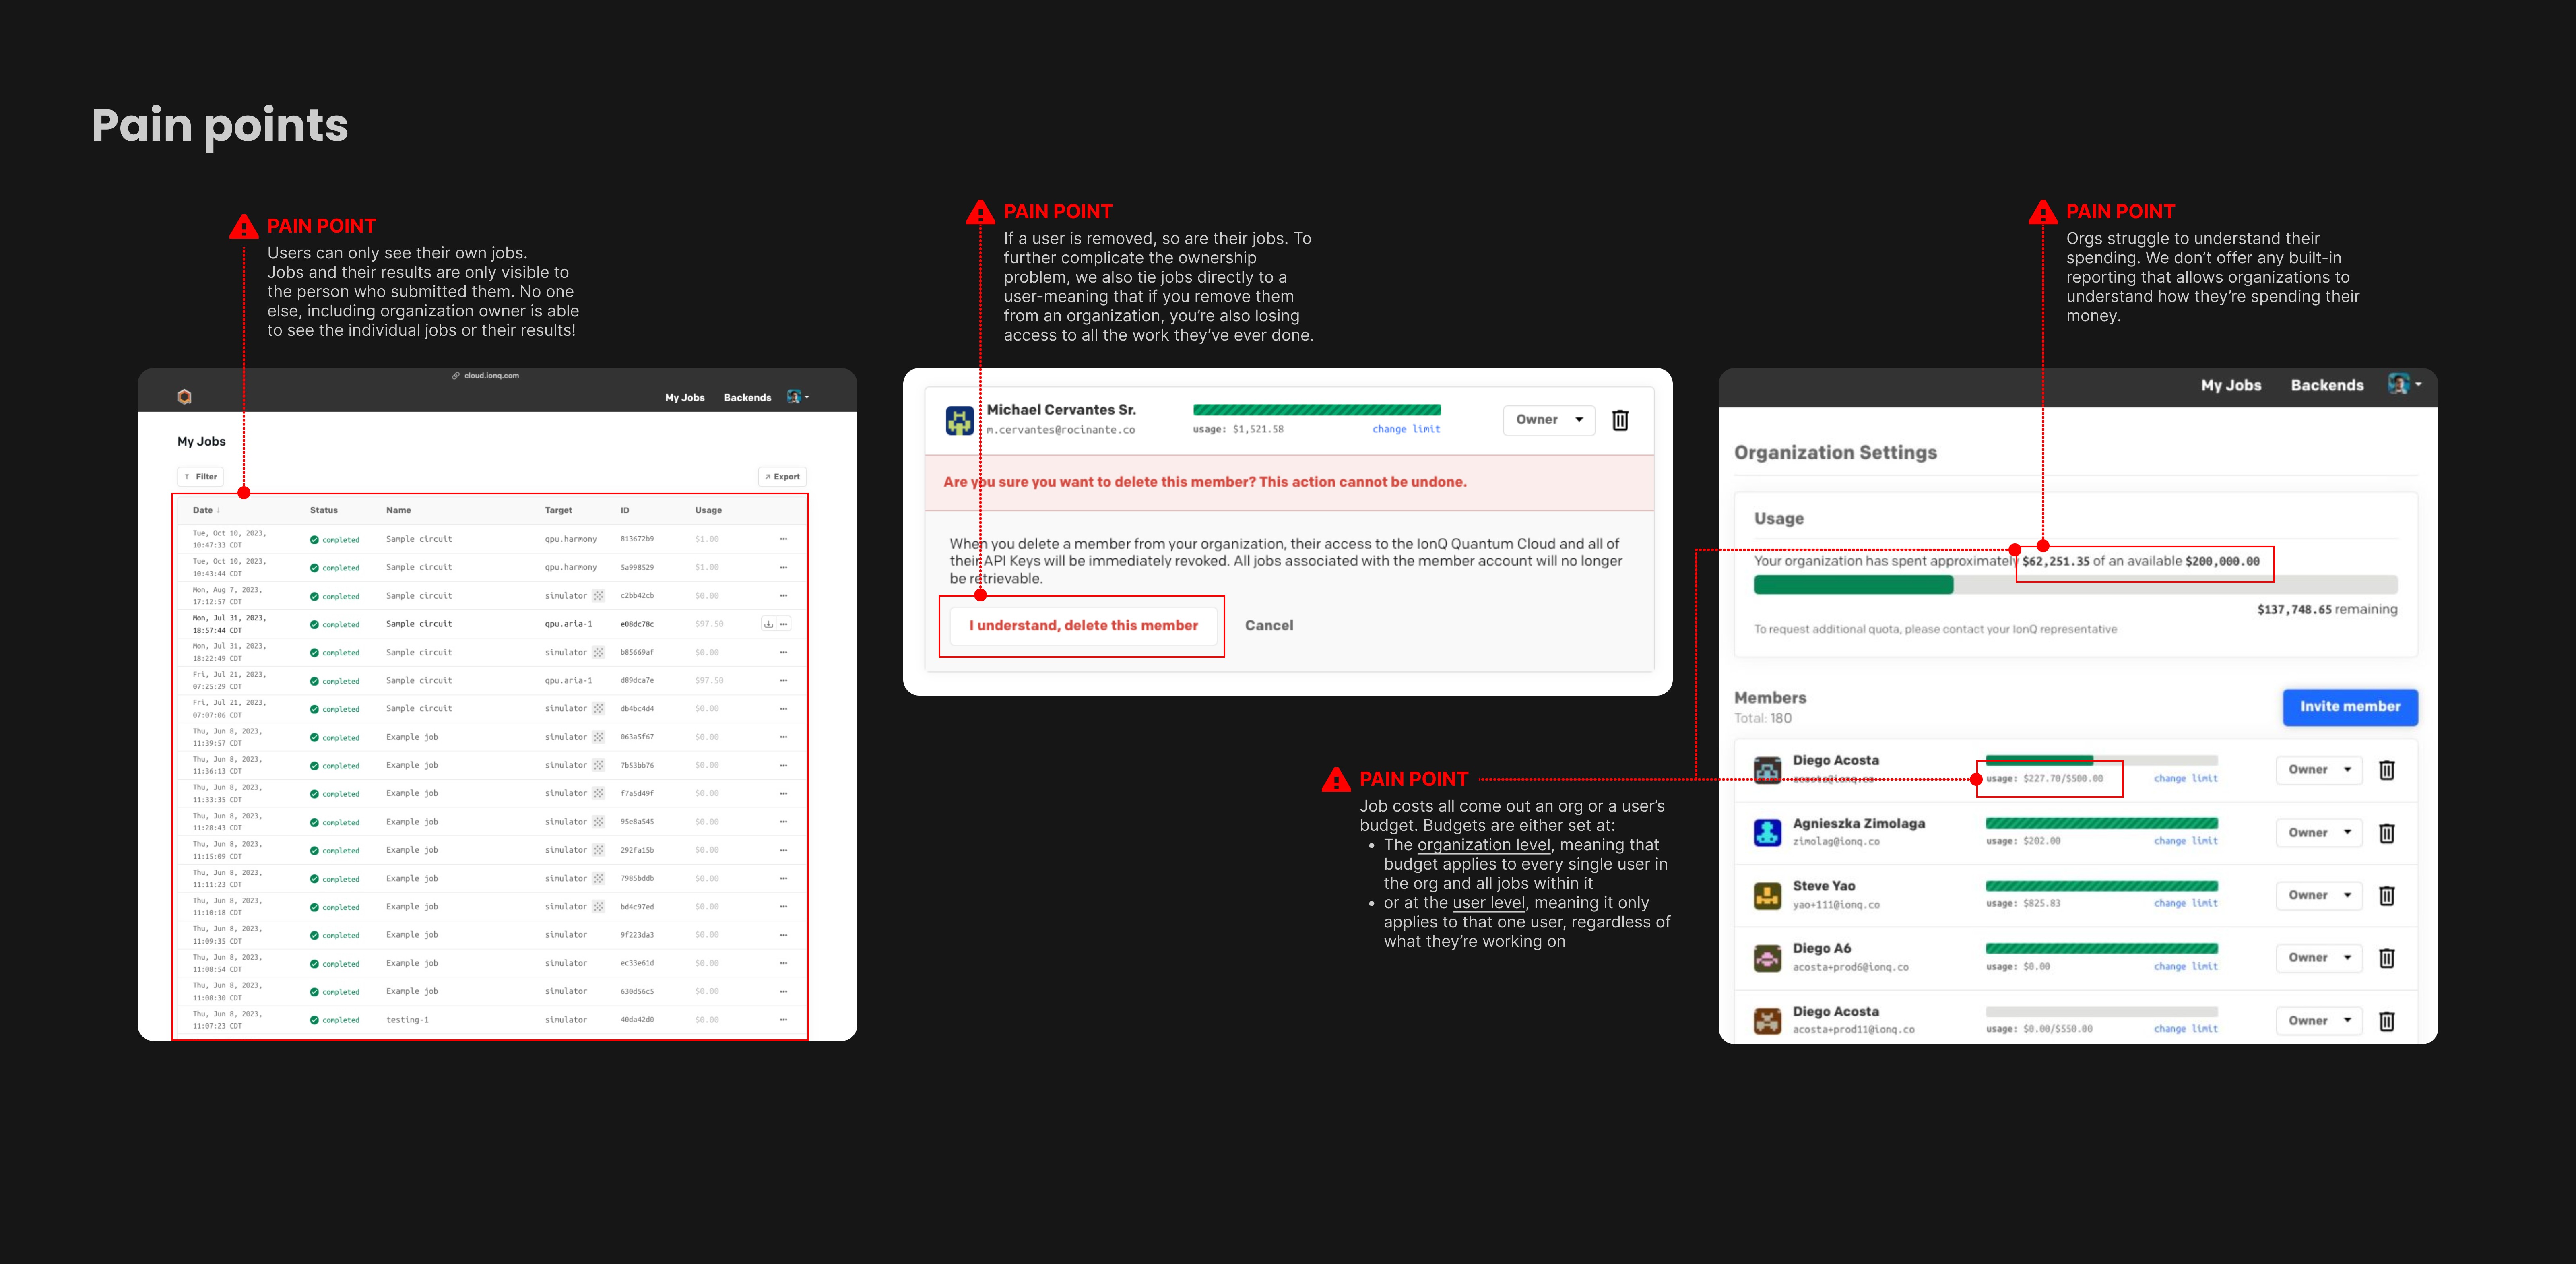
Organisations: they have a contract with us. They struggle to understand their own spending. we manually create reports and provide them on ad-doc basis
Jobs: quantum programs submitted to a backend belonging to the user and organization. Today users can only see their own jobs. If users are removed so are their jobs
API keys: tokens that provide access to backends allowed under organisation to submit quantum programs "jobs"

Low fidelity wireframes
I started with low fidelity wireframes in miro just to get a general sense of the information architecture and how I want to place the workspaces in the cloud console. It allowed me to make several assumptions and yet get a general sense of what substantial changes the console would need to undergo.


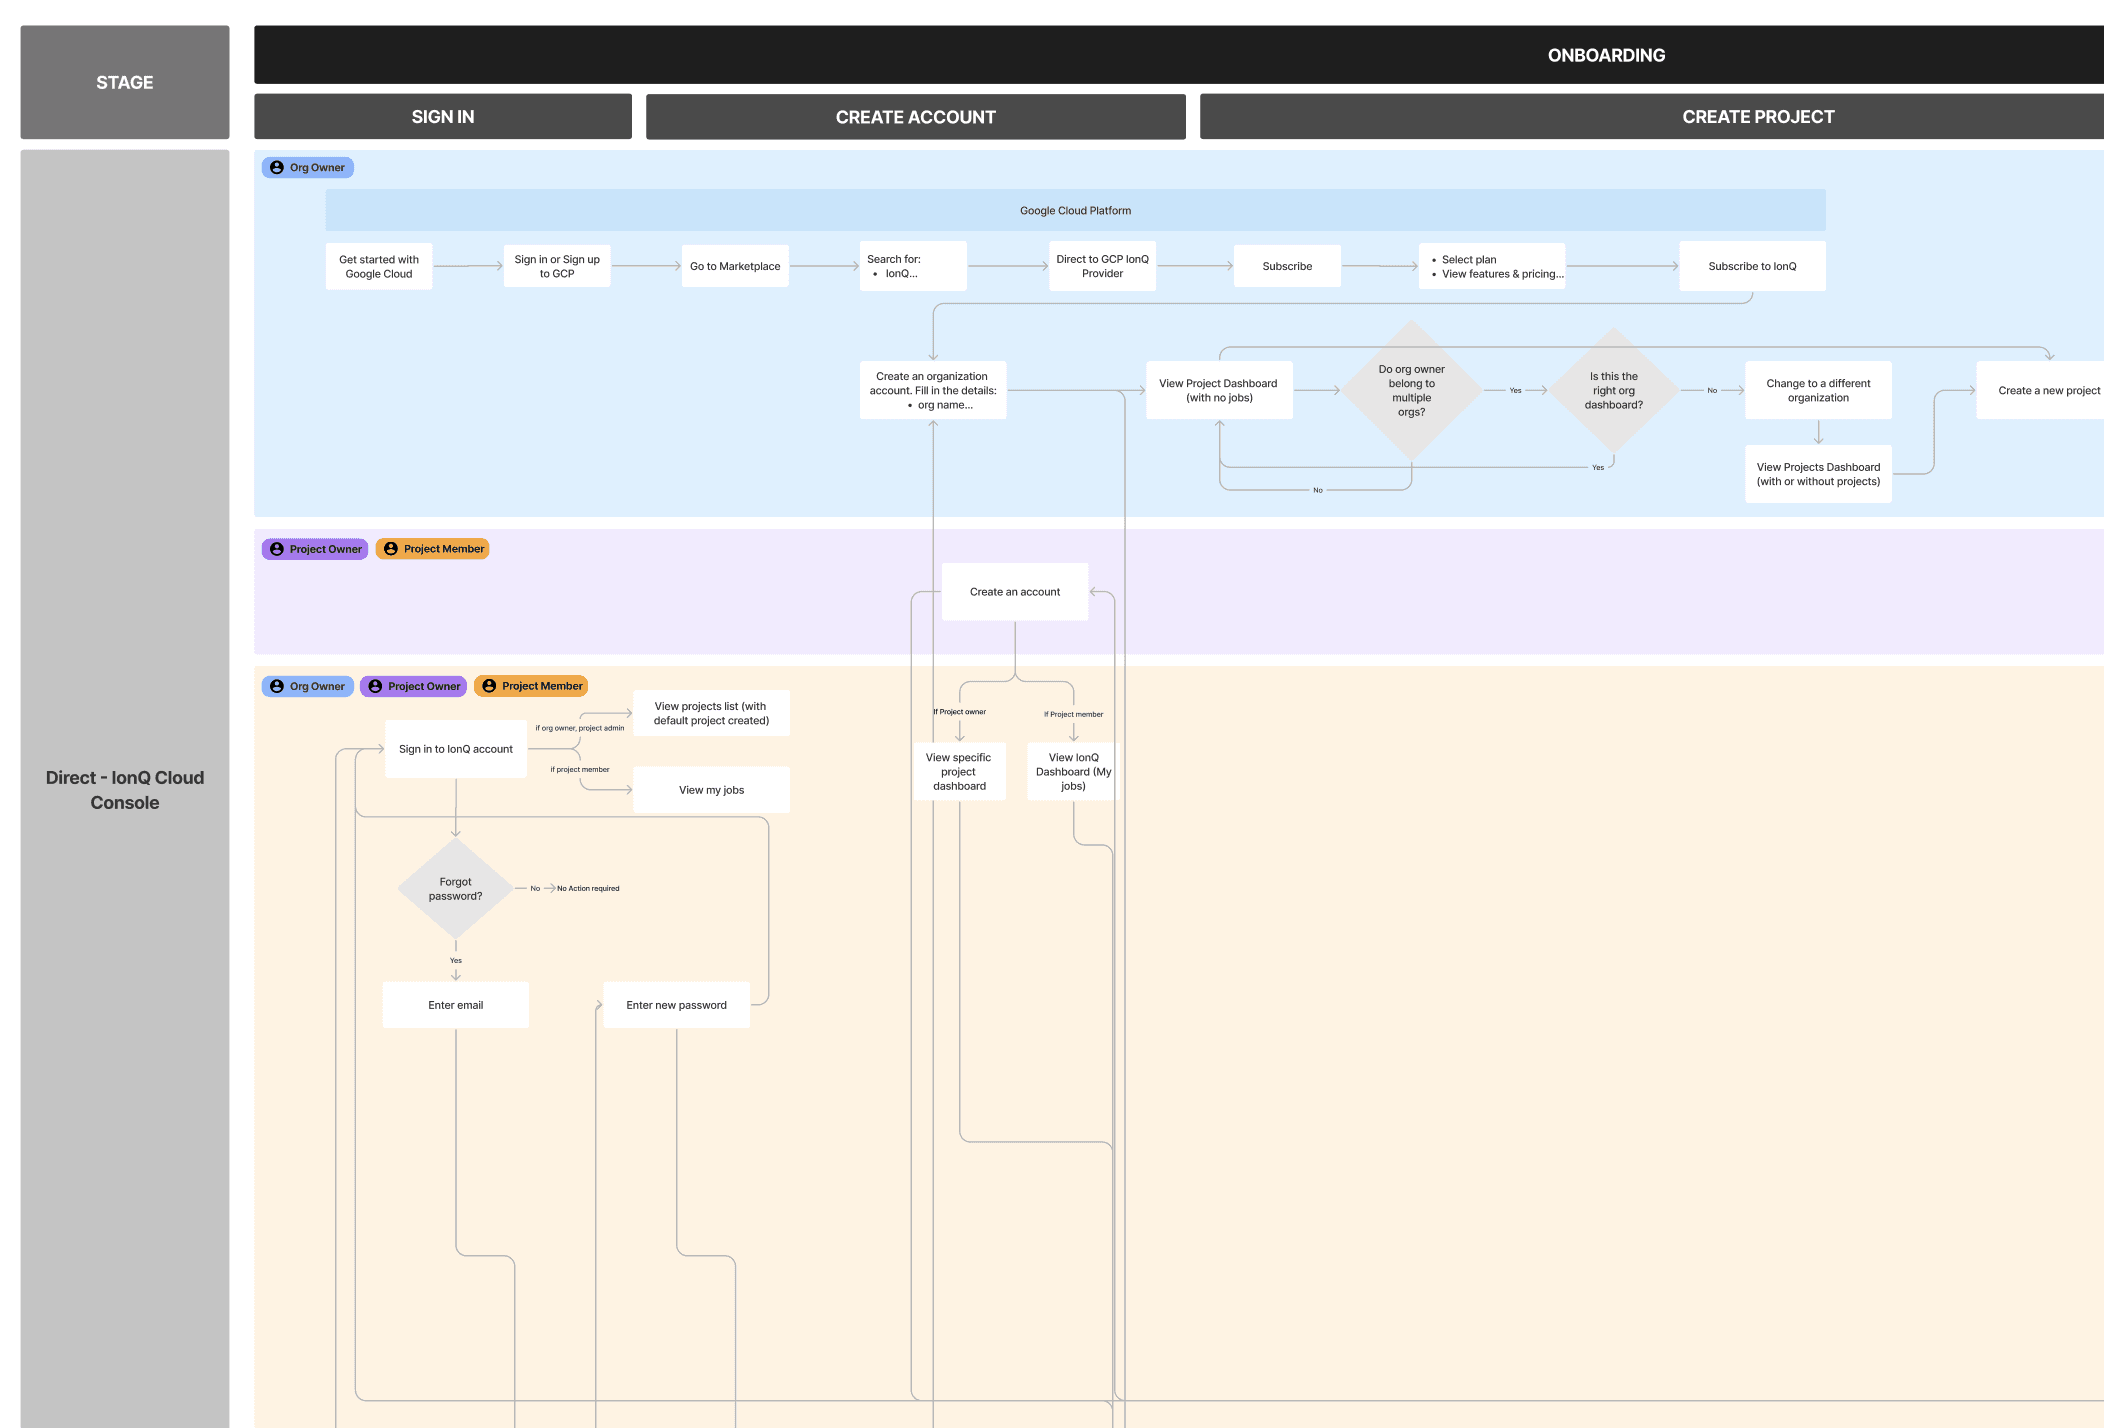
Understanding interactions
Right after the first wireframes I started mapping out user flows. They helped to think step by step what customer would do when utilizing the features we were building. It helped me to discover edge cases and understand holistically the overall scope of the features to make them usable. It was a great way to understand the scope of the interactions before devoting all my time to crafting the wireframes. They served as an excellent segway to getting alignment with engineers.
Alignment with engineers
Once the user flows and low fidelity wireframes were created I would go back to engineering to validate my assumptions with them. I would walk them throug the flows and get their feedback about the changes proposed. I would then understand the technical limitations or redefine my assumptions.
Component Design and Style Guide
As we were working on defining the features and their usability we also started developing our Quantum Platform Design System. To ensure consistency and scalability, we developed a comprehensive design system and style guide. This included defining reusable UI components, establishing design patterns, and documenting guidelines for their usage across the product interface.
"Projects" was a large initiativee that needed an entire console overhaul therefore reusable components were leveraged to be scalable. Engineers were able to replace old components with the new components and implement style guide on top of it.

Usability Testing
We conducted usability testing sessions over zoom using prototyped mockups with real users to gather feedback on the functionality and whether the features proposed are resonating with their needs.
Based on the insights gained, we iterated on our designs, making refinements and improvements to address user pain points and enhance overall usability. At the end of the testing efforts I created a report outliing the insights and product recommendations and shared it with the main stakeholders.
2
Internal users working directly with customers
3
National research lab leaders


Finding: Users needed better tools to monitor expenditures and understand burn rates for resource planning. Additionally, project owners frequently requested detailed usage information to track member activity.
Design Decision: Integrated real-time budget tracking and alerts to help users manage resources effectively. Although advanced reporting features were not feasible, we implemented aggregated usage information per user in a project, signaling to owners which members are actively submitting jobs.

Finding: Users required a way to track jobs submitted over time, distinguishing between different types like QPU and simulation jobs.
Design Decision: Introduced enhanced job tracking and filtering options, allowing users to easily manage and review job submissions based on type and time frame.

Finding: Users were apprehensive about running jobs on QPU due to perceived high costs and wanted more transparency.
Design Decision: Introduced a feature that clearly displays QPU costs, helping users make informed decisions about job submissions.
Finding: Users struggled with managing project spaces due to a lack of consolidated views and difficulties in handling shared and private spaces.
Design Decision: Redesigned the project space with a unified view to simplify project management and improve visibility. Enhanced the interface to better manage shared and private workspaces.

Finding: Users found the existing naming and assignment of jobs confusing, leading to difficulties in project organization.
Design Decision: Improved clarity by renaming "jobs" to "my jobs" and allowing for easier reassignment of jobs between projects.

Finding: Users found it challenging to manage multiple API keys over time, especially since API keys are tied to specific projects, leading to the creation of numerous keys. It became difficult for users to keep track of and locate these keys.
Design Decision: Streamlined API key management by introducing better labeling and organization, giving API keys a recognizable footprint so users can easily find them on their PCs. This improved overall usability and reduced the complexity of managing multiple keys.

Finding: With many changes introduced to the platform, there was a need to guide customers effectively to ensure they could fully utilize the new features.
Design Decision: To facilitate smoother onboarding, the first project is automatically created for new customers, with existing jobs organized within this project. Enhanced the onboarding process by adding information to the onboarding email and a banner in the cloud console linking to the documentation. Included detailed user guides in the docs, trained internal teams to support customer education, and conducted in-person training sessions for customers.
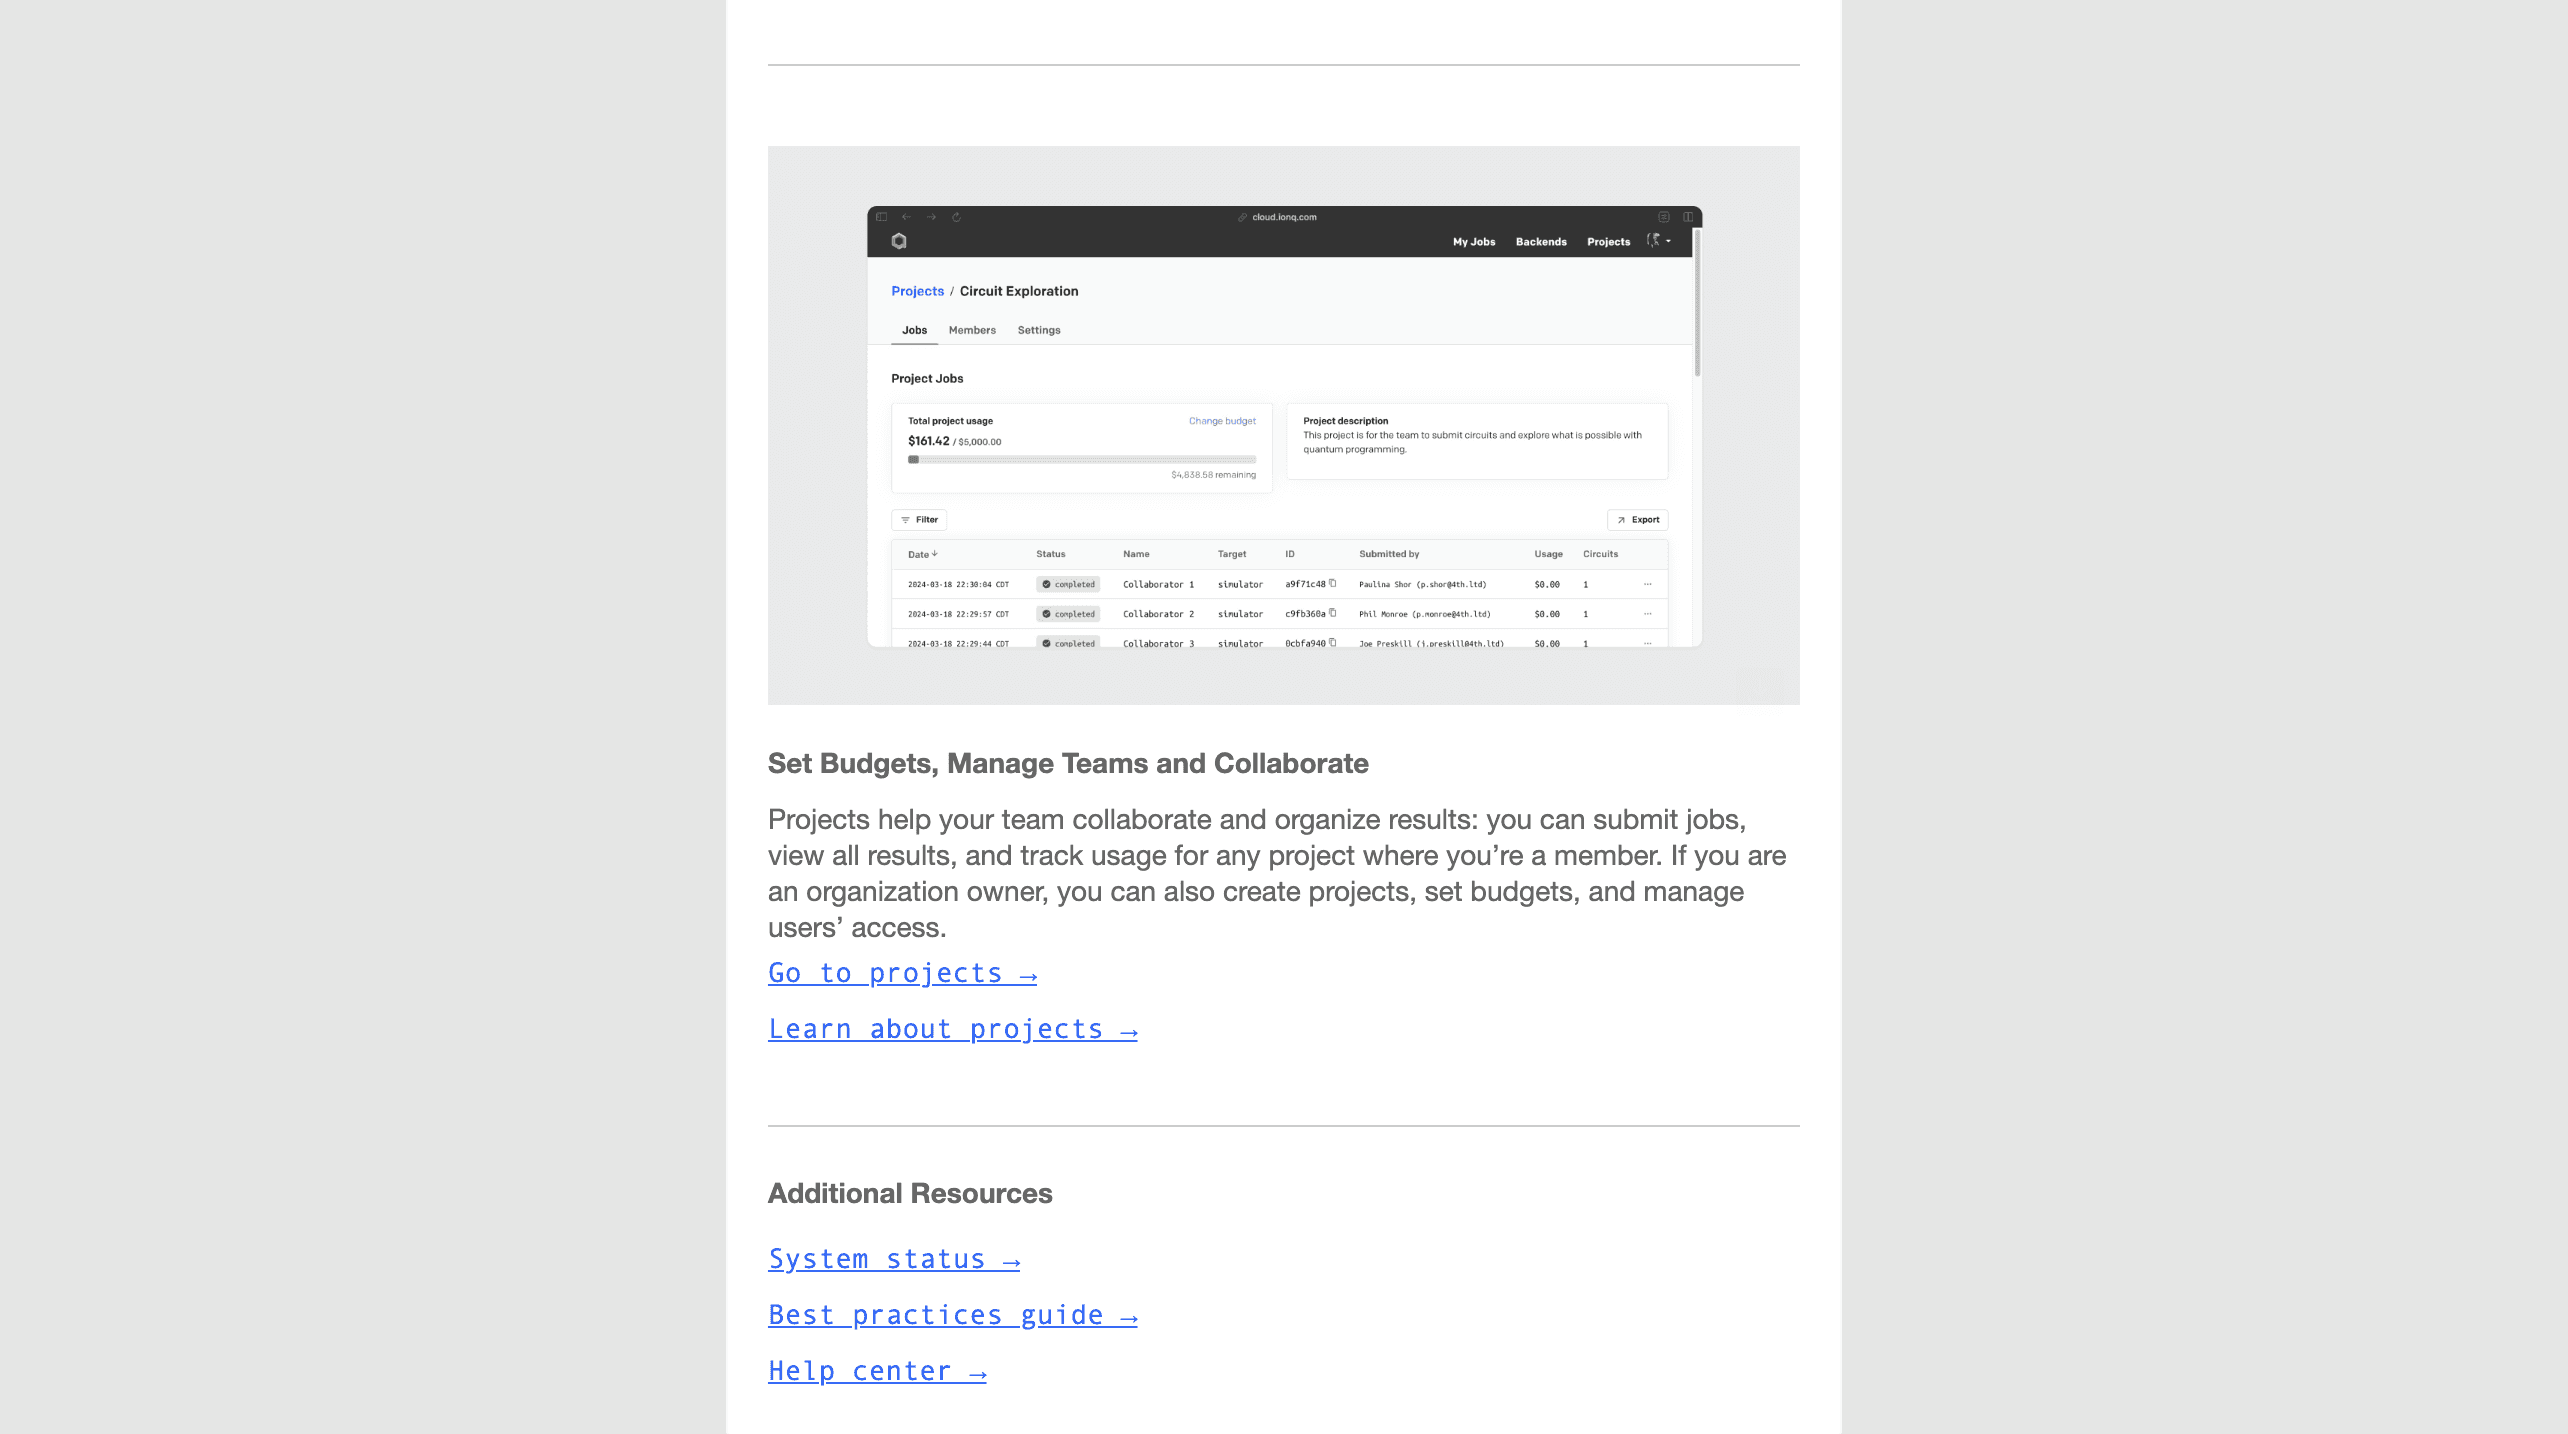
Onboarding email
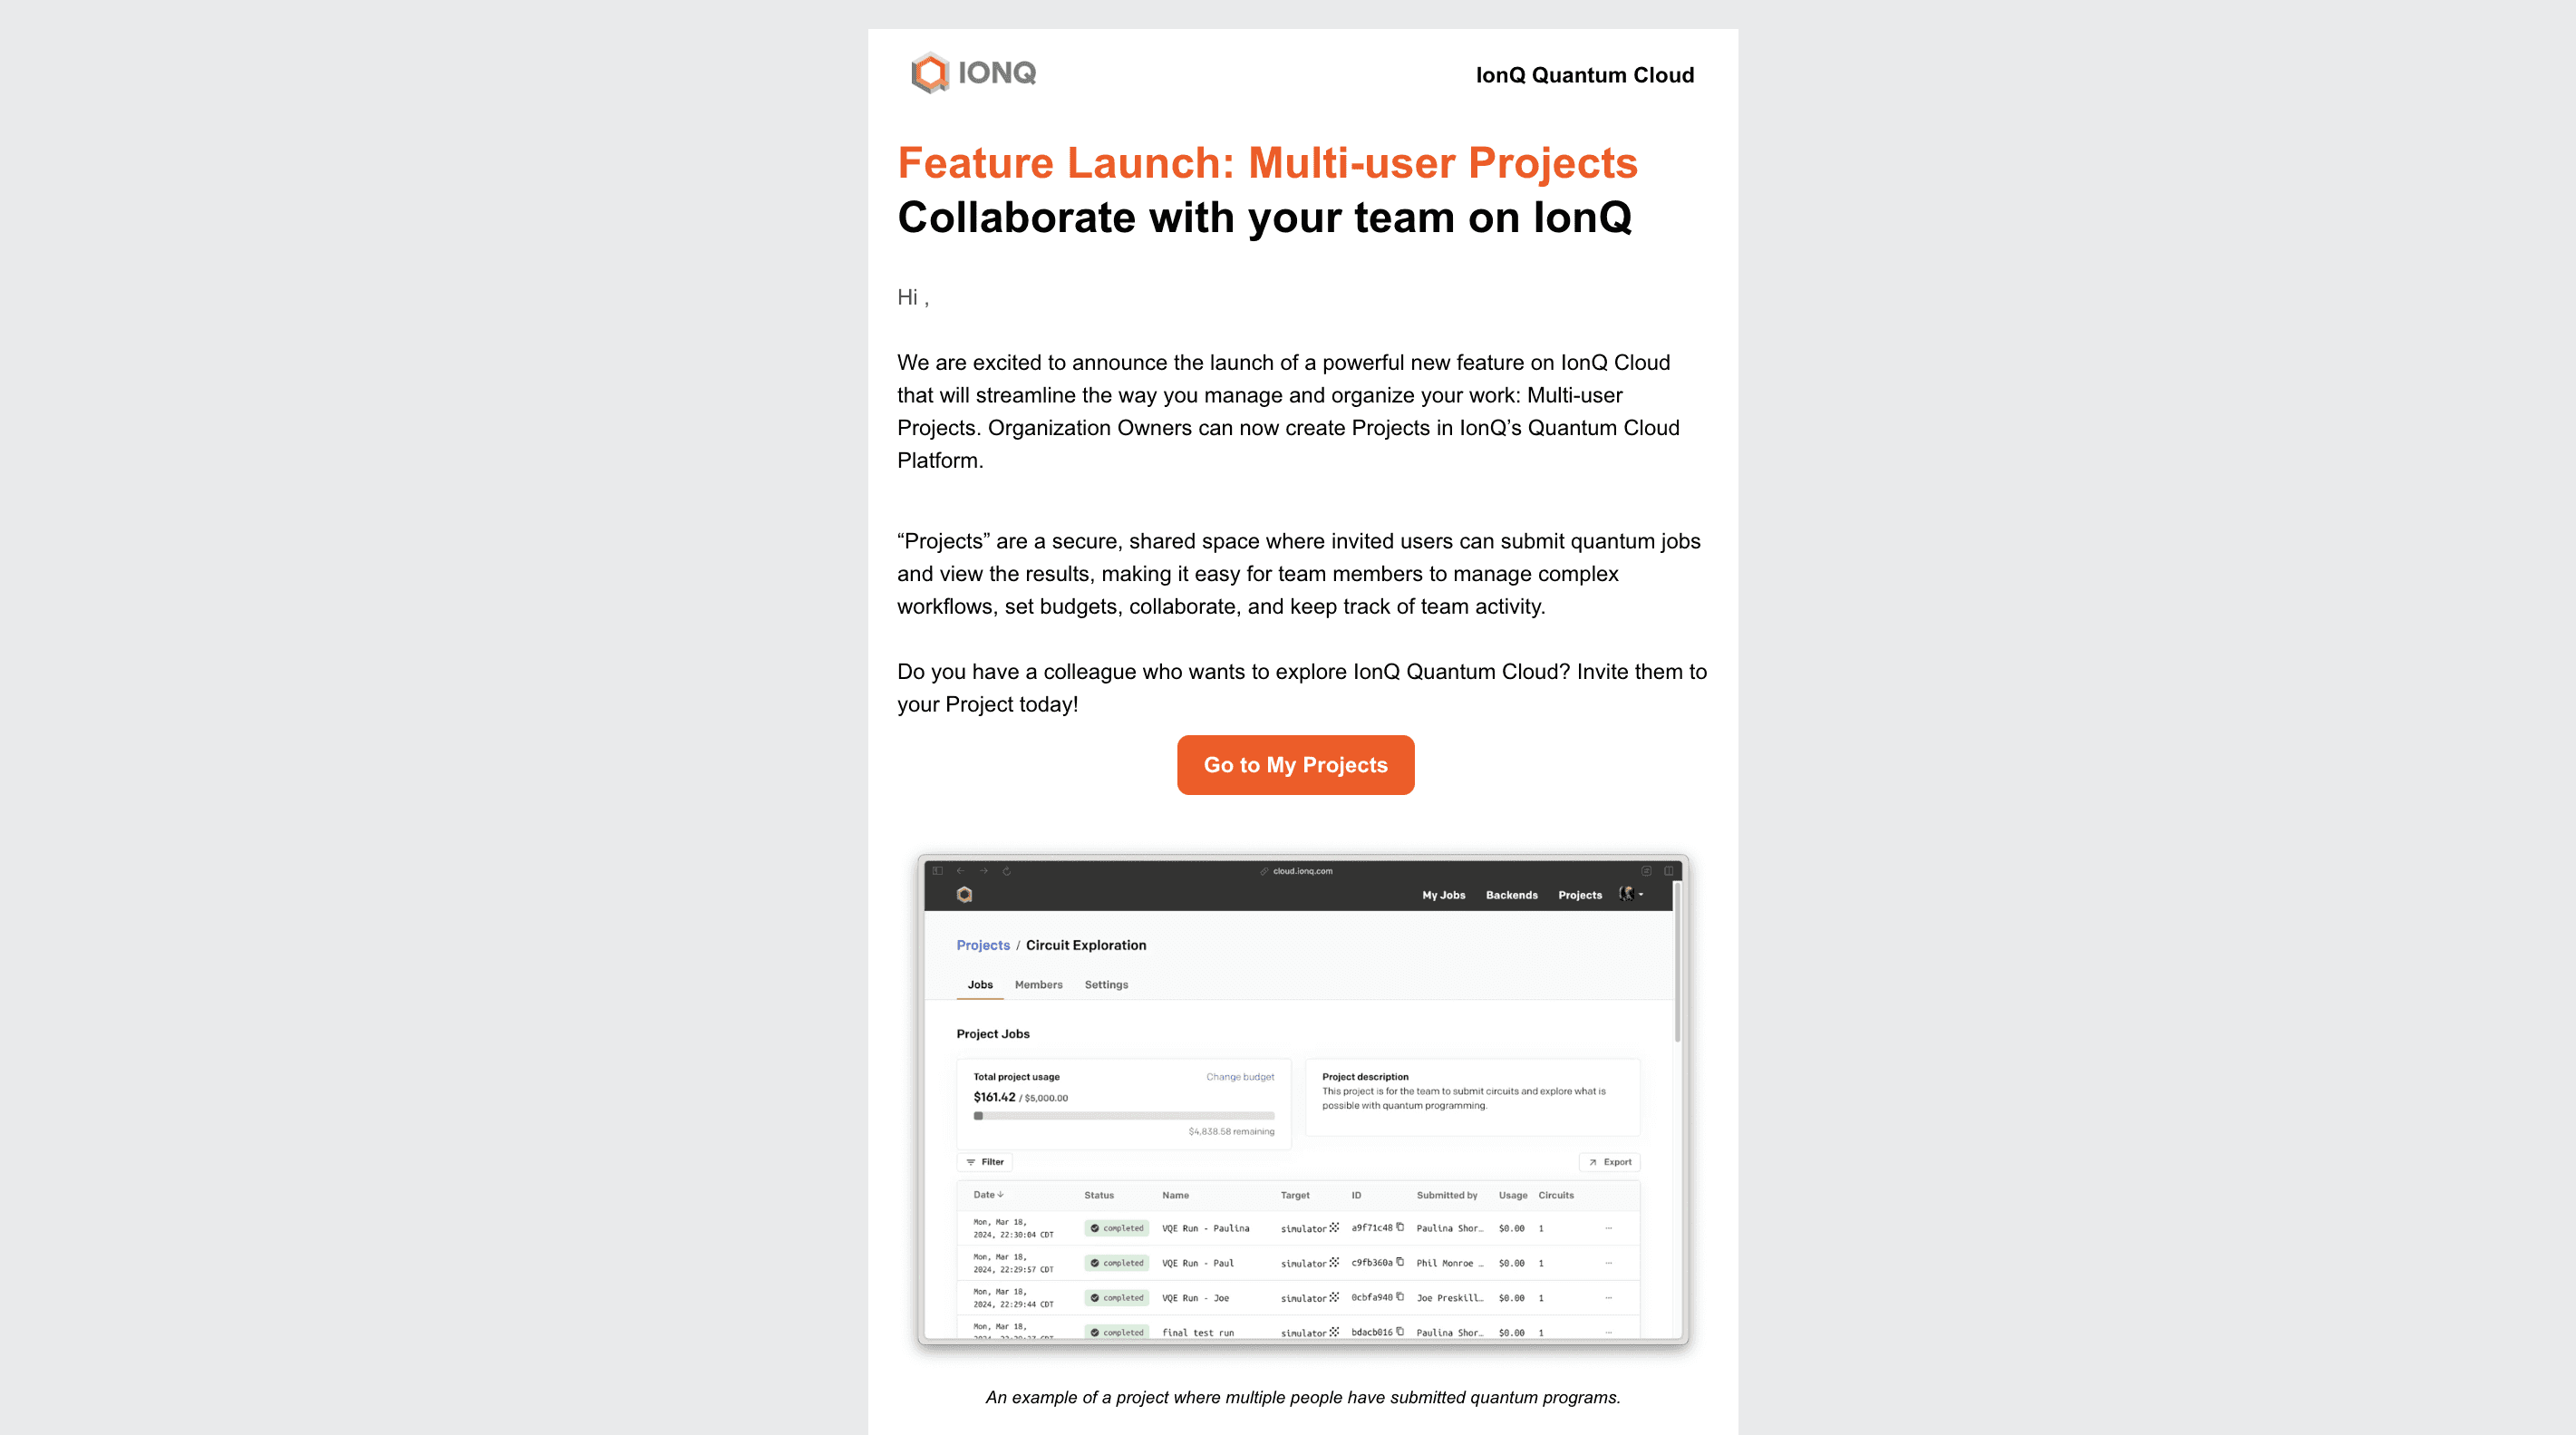
Feature release email


Iterations
Right before the release of Alpha we met with couple of customers to confirm with them the scope of MVP. We used my mockups as we didn't have a coded version ready to be shown to the customers.
Driving alignment
The road to alpha was filled with alignments and countless meetings. As we were redesining the entire cloud console there was many edge cases to discover and discuss. My role was to provide guidance and document the changes we need to introduce.
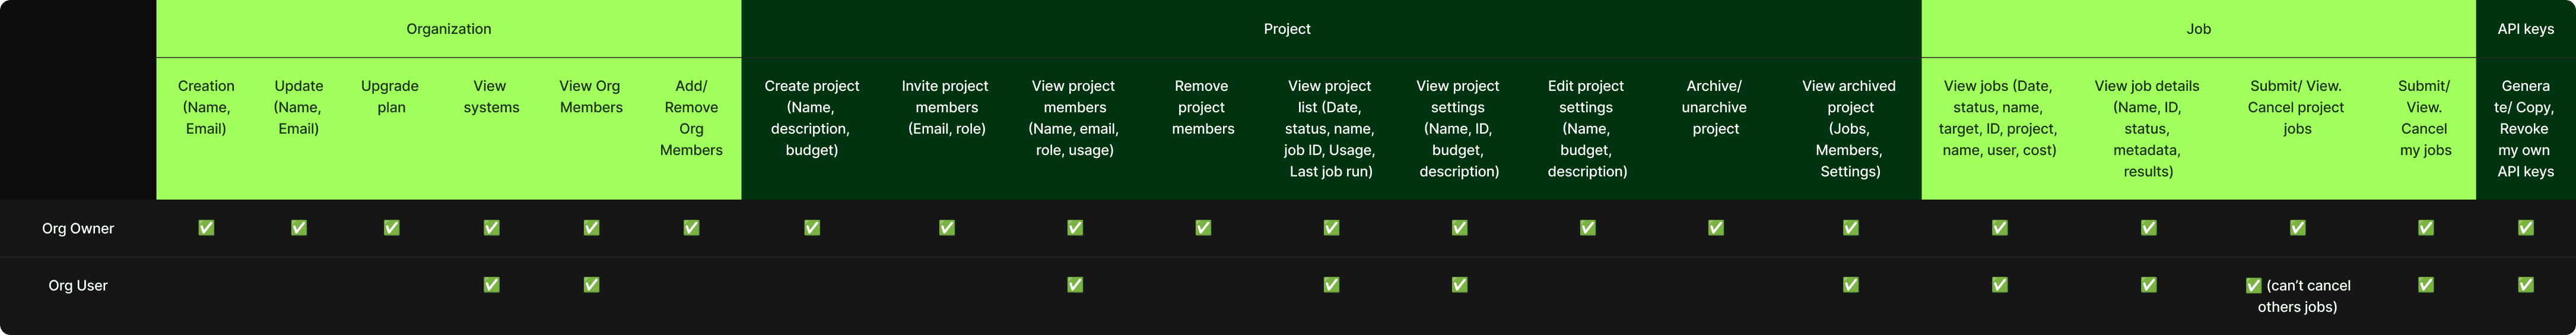
Mapping of roles and permissions
User Acceptance Testing
The last step was to conduct the UAT which was not a simple task. As we had two roles for each different types of access we had to write down specific scenarios to test to be able to verify that I am getting the same results as the TPM on the project. Having detailed acceptance testing was of a huge help to write these scenarios.
Beta Public Release
Process to beta was very much about preparing assets to help customers be onboarded with the new features. And that included writing user guides available on a newly launched docs platform (https://docs.ionq.com/user-manual/projects), creating content for the feature announcement email, making changes to the existing onboarding email and set up telemetry so we can gather data about the feature utilization right from the start.
As more users got hands on with the features we received feedback that we could possibly in the future rethink where projects are managed. Maybe there is a simpler view to manage all projects at once instead of clicking on each of them and doing it from a specific project workspace. Or the management could happen from the table itself. We are still in a discovery phase and wanting to get as much feedback as possible to make a call what we should achieve in Post-MVP.


Success metrics
As we launched the collaborative spaces we established what telemetries we wanted to track that would allow us get a good understanding whether the features are being utilized in the organizations.
# KPIs
Active Users = # of Users who have submitted a job in a (90 day window)
Project Users % = % of Active Users who are active in a shared Project
# PIs
Org Project Usage = % of Org Users (in orgs > 1 user) active in a shared project
Individual Project Usage = % of Active Users in Single-member orgs using Projects
% of Projects with a configured Budget
# of Archived Projects
Average # of Project member
Average # of Projects per Org
# of jobs run in a budgeted project
As the industry is still in its early stages/ user base is still growing, the features we launched are mainly utilized by the admins. Setting a project budget has been a killer app. And this is where we see most utilization right now. We will need to wait for the industry to pick up to see more traffic in the shared workspaces.
The composite success metric would look like:
Percentage of projects
With greater than 20 job submissions in the last 90 days
That are using a project with a budget set
13%
Active users in multi-user projects
40%
of projects with budget
Results and Impact
Increased User Engagement: Simplified navigation and collaborative workspaces led to more frequent platform use and better team collaboration.
Improved Project Management Efficiency: The unified project view and enhanced management of shared/private spaces streamlined tasks, reducing time spent on project management.
Greater Budget Transparency: Real-time budget tracking and aggregated usage data empowered better resource management and reduced budget overruns.
Positive User Feedback: Users appreciated the clarity of new features like automatic project creation and transparent QPU cost displays, leading to reduced support requests.
Business Impact: Enhanced user satisfaction contributed to increased customer retention, especially among key government and enterprise clients.
Lessons Learned
Alignment and Documentation: Extensive stakeholder alignment on the scope and solutions and detailed documentation of the decision taken were crucial to address the platform's complexity.
Rigorous Testing: Detailed scenario-based UAT ensured the new features worked across different user roles and access types.
Customer Rationale: We learned the importance of identifying diverse customer needs earlier in the process to better align our design.